

CometBFT QA Results v0.37.x
This iteration of the QA was run on CometBFTv0.37.0-alpha3, the first v0.37.x version from the CometBFT repository.
The changes with respect to the baseline, TM v0.37.x as of Oct 12, 2022 (Commit: 1cf9d8e276afe8595cba960b51cd056514965fd1), include the rebranding of our fork of Tendermint Core to CometBFT and several improvements, described in the CometBFT CHANGELOG.
Testbed
As in other iterations of our QA process, we have used a 200-node network as testbed, plus nodes to introduce load and collect metrics.Saturation point
As in previous iterations, in our QA experiments, the system is subjected to a load slightly under a saturation point. The method to identify the saturation point is explained here and its application to the baseline is described here. We use the same saturation point, that is,c, the number of connections created by the load runner process to the target node, is 2 and r, the rate or number of transactions issued per second, is 200.
Examining latencies
The following figure plots six experiments carried out with the network. Unique identifiers, UUID, for each execution are presented on top of each graph.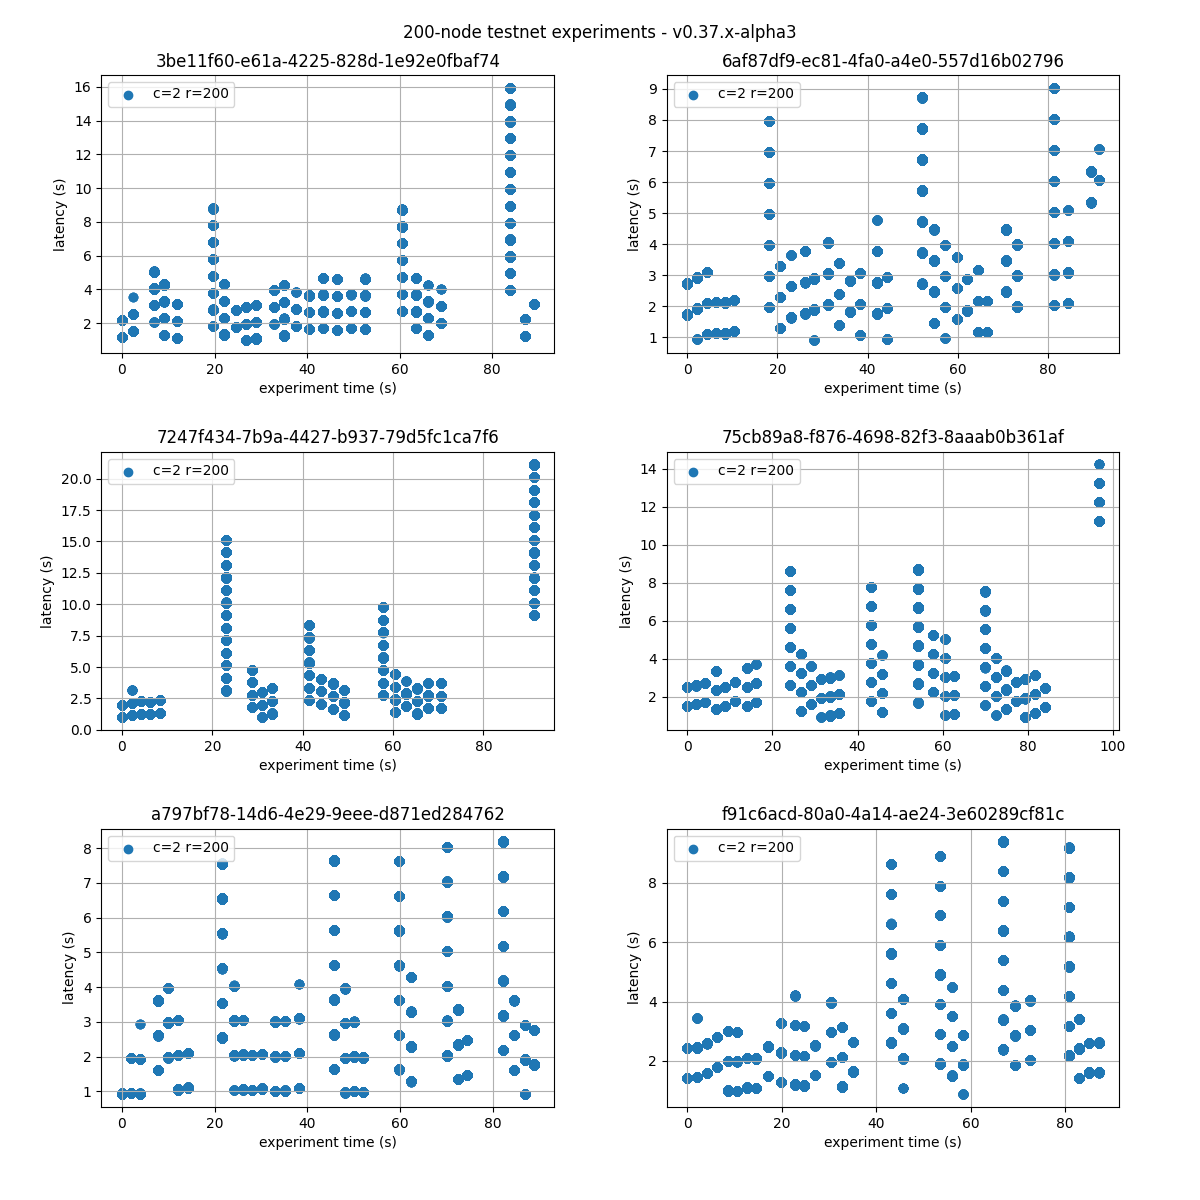
75cb89a8.
 .
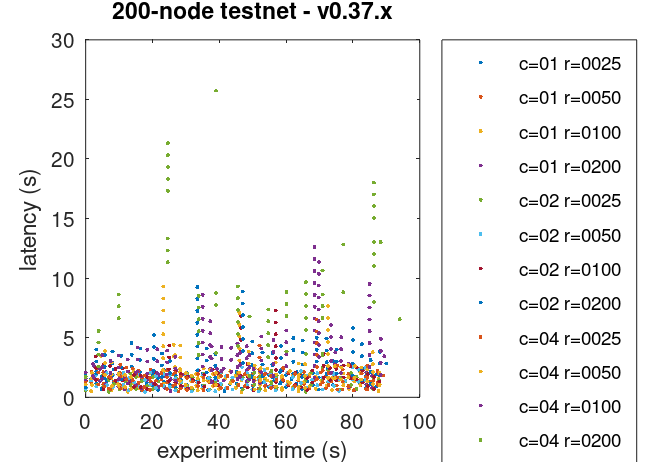
For reference, the following figure shows the latencies of different configuration of the baseline.
.
For reference, the following figure shows the latencies of different configuration of the baseline.
c=02 r=200 corresponds to the same configuration as in this experiment.
Prometheus Metrics on the Chosen Experiment
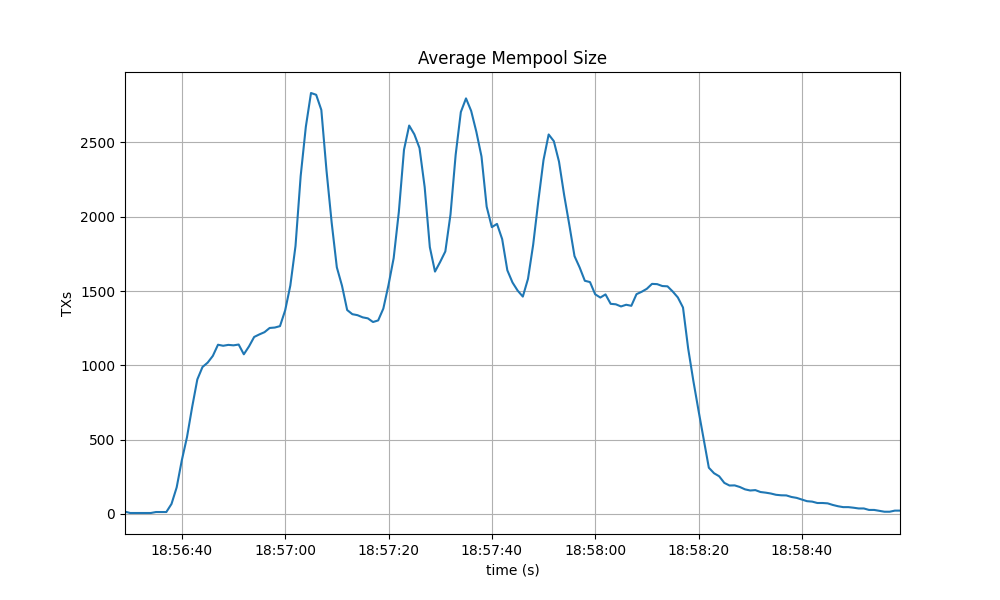
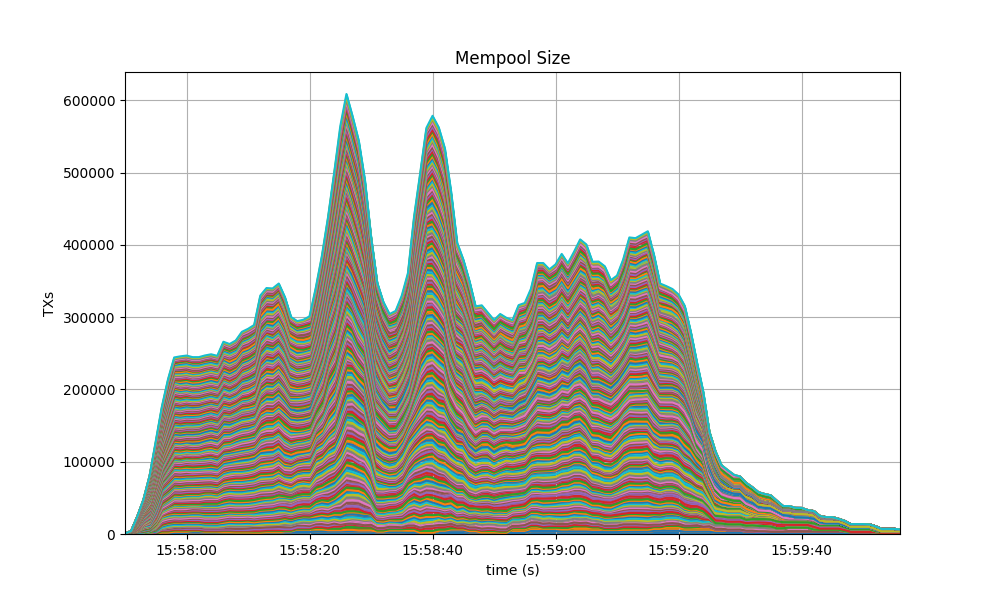
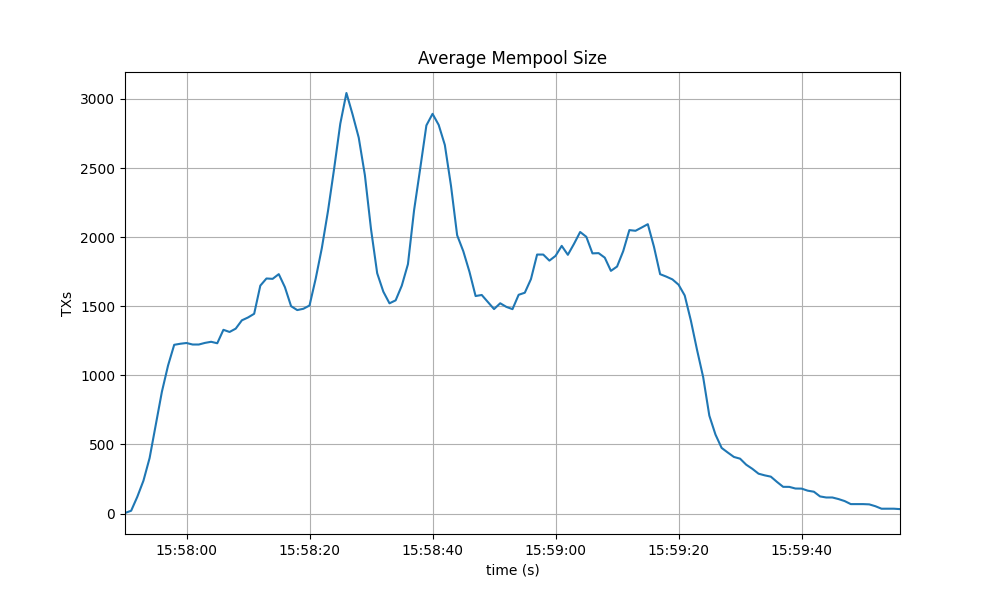
This section further examines key metrics for this experiment extracted from Prometheus data regarding the chosen experiment.Mempool Size
The mempool size, a count of the number of transactions in the mempool, was shown to be stable and homogeneous at all full nodes. It did not exhibit any unconstrained growth. The plot below shows the evolution over time of the cumulative number of transactions inside all full nodes’ mempools at a given time.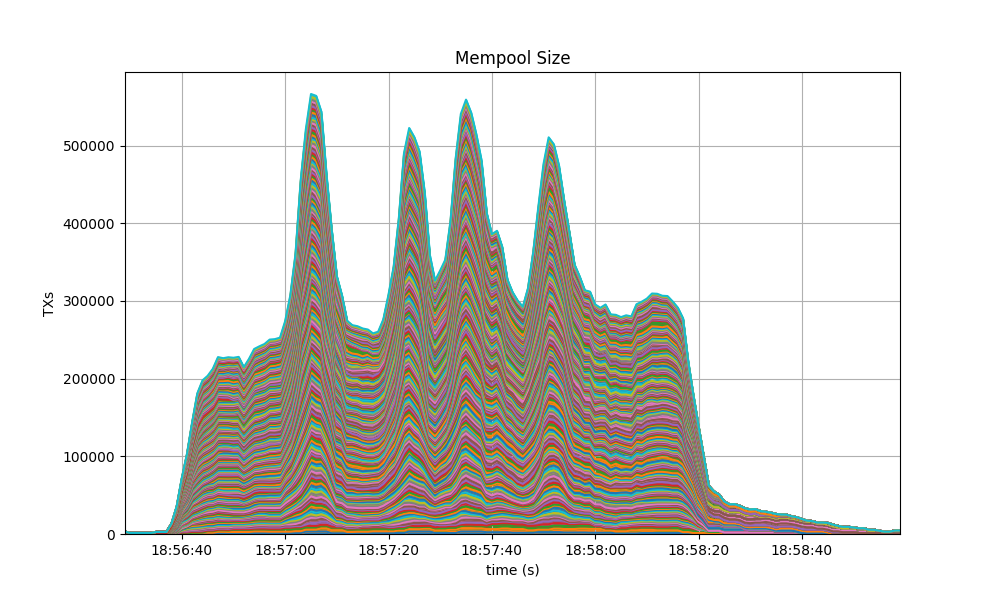
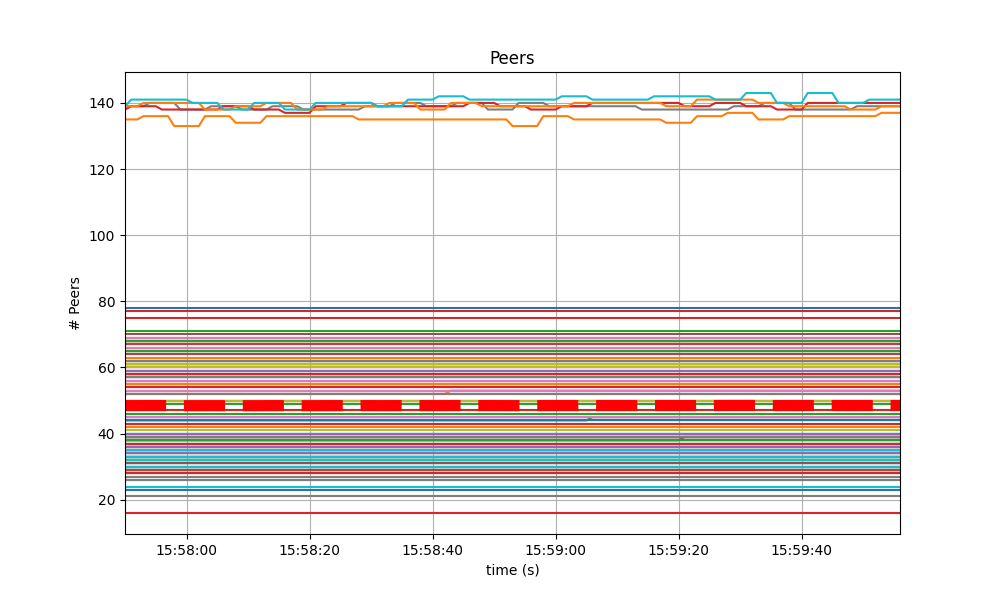
Peers
The number of peers was stable at all nodes. It was higher for the seed nodes (around 140) than for the rest (between 16 and 78). The red dashed line denotes the average value.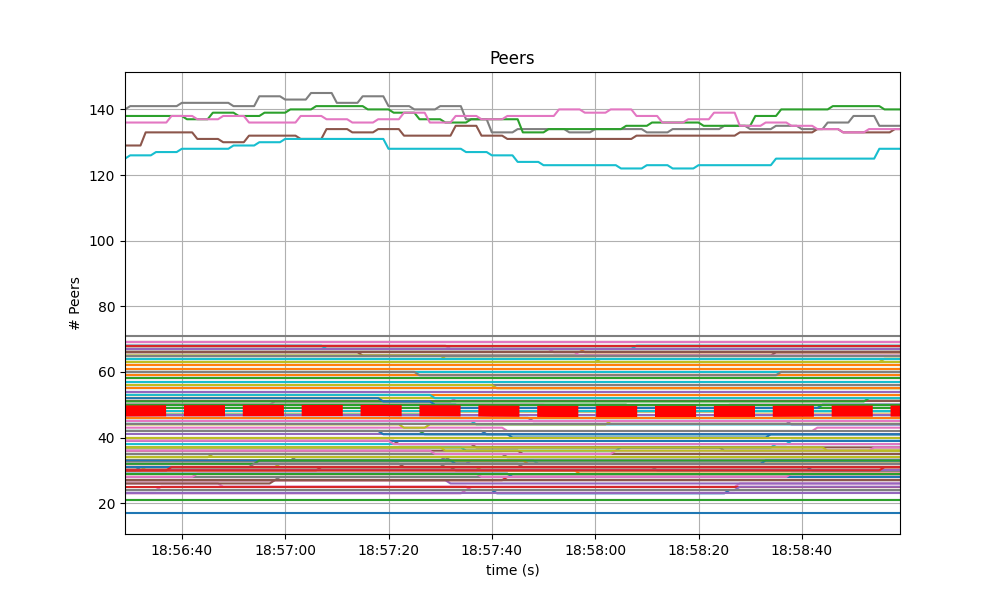
Consensus Rounds per Height
Most heights took just one round, that is, round 0, but some nodes needed to advance to round 1 and eventually round 2.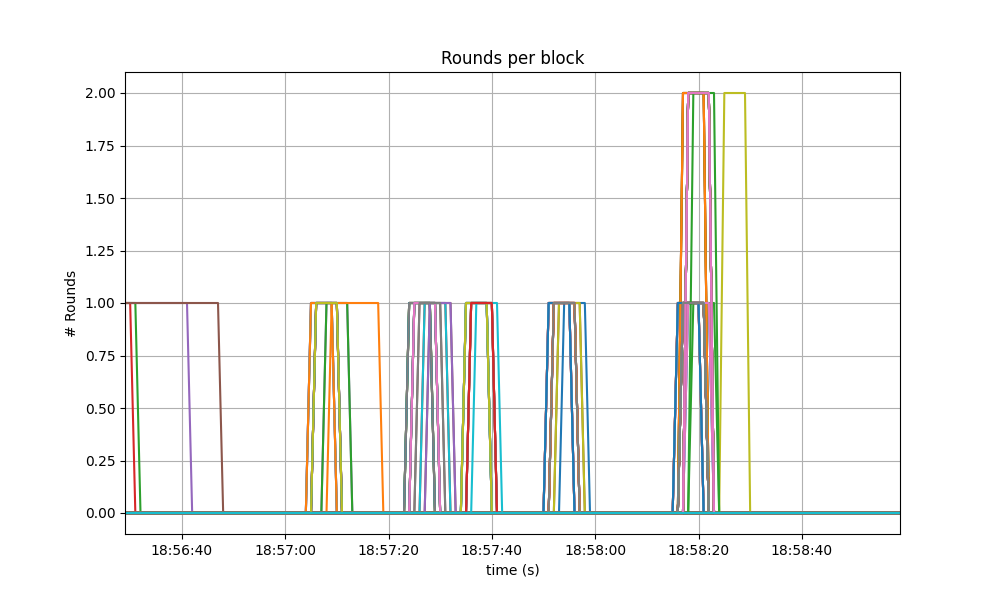

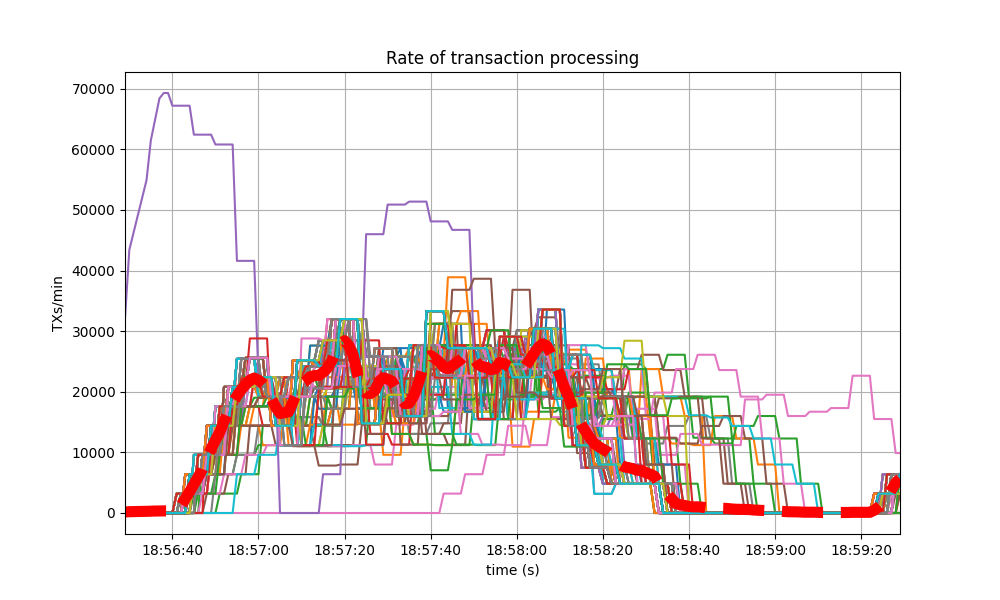
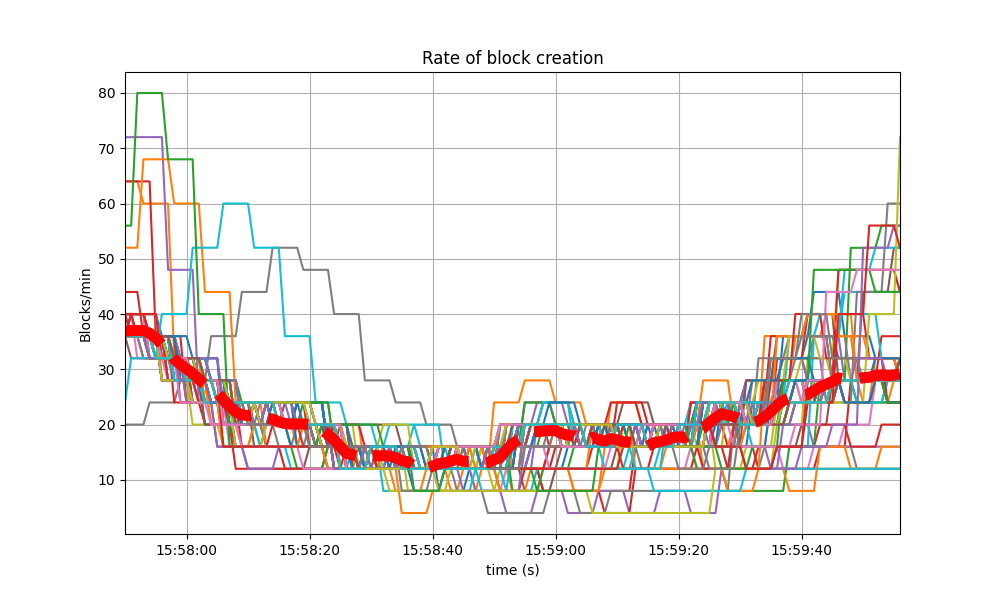
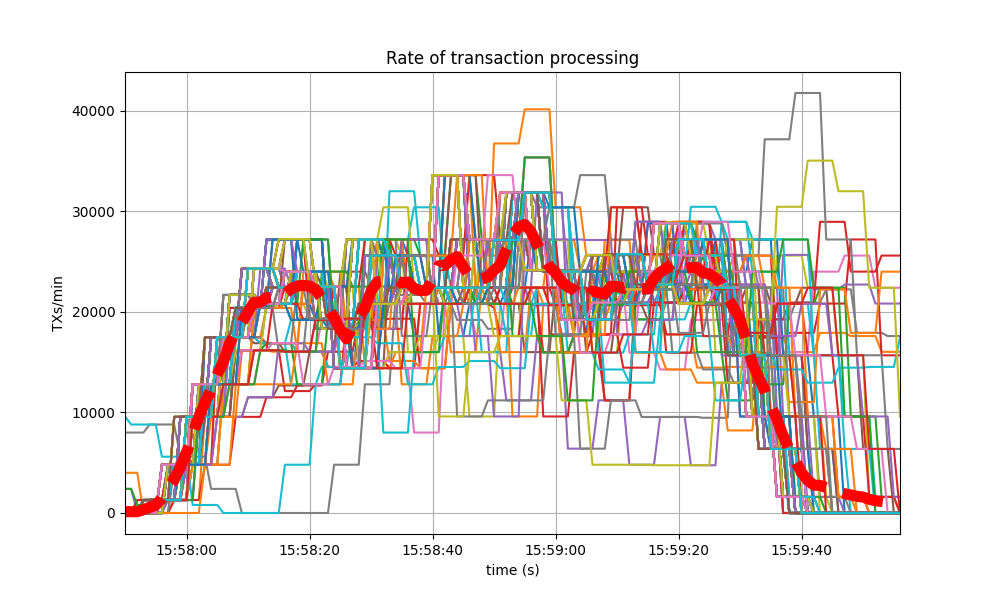
Blocks Produced per Minute, Transactions Processed per Minute
The following plot shows the rate in which blocks were created, from the point of view of each node. That is, it shows when each node learned that a new block had been agreed upon.
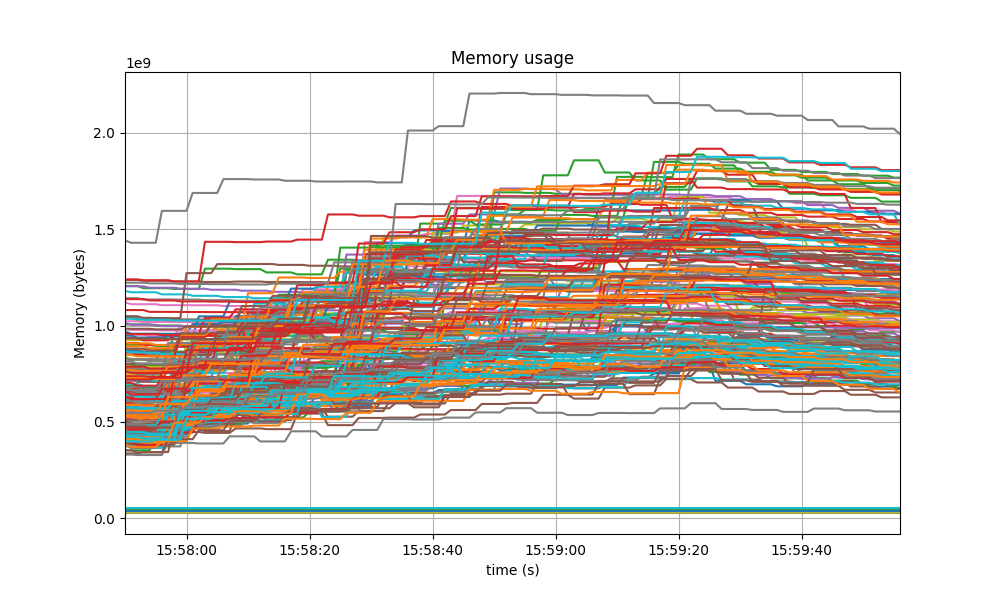
Memory Resident Set Size
The Resident Set Size of all monitored processes is plotted below, with maximum memory usage of 2GB.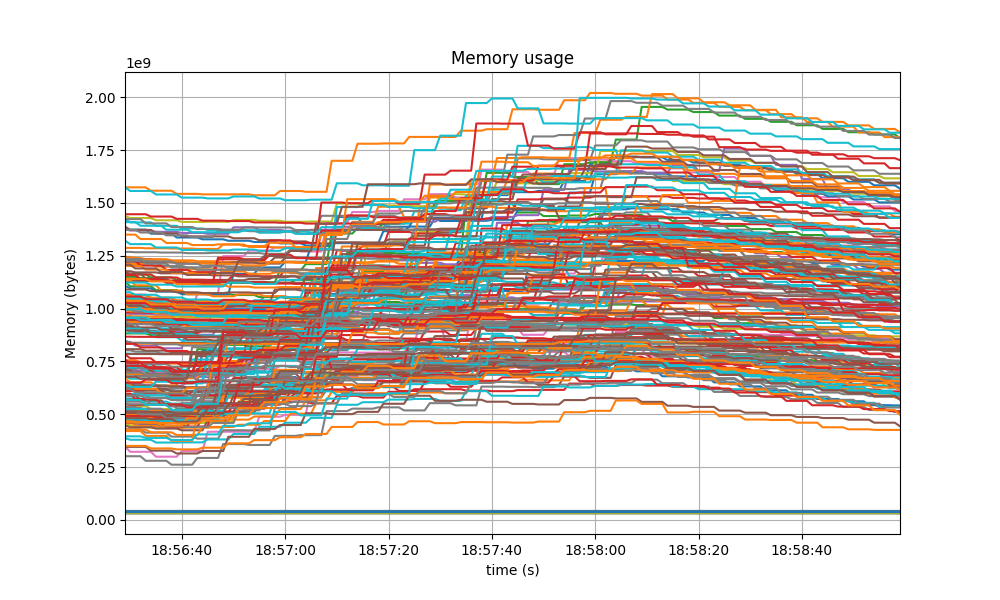
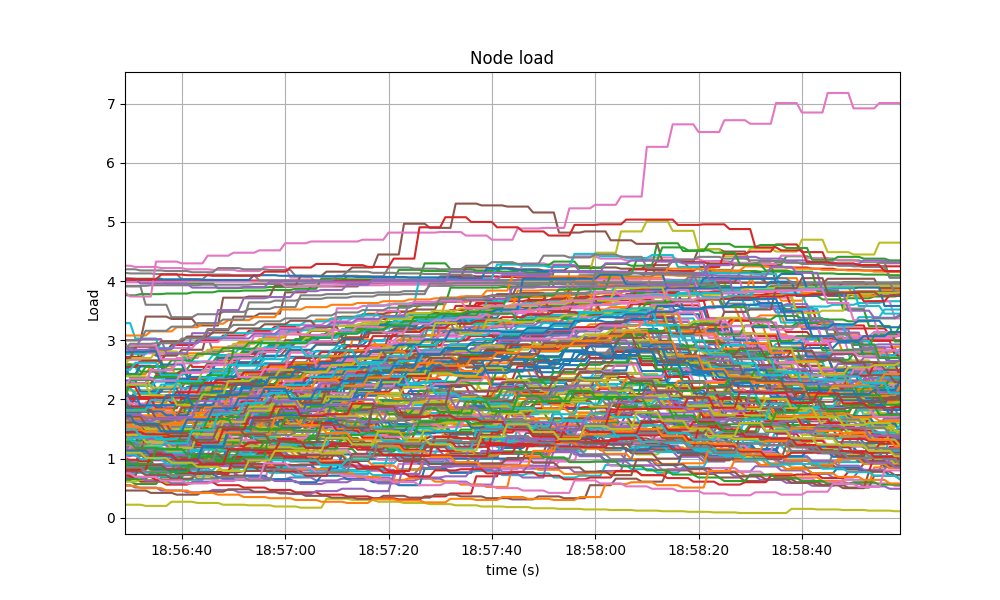
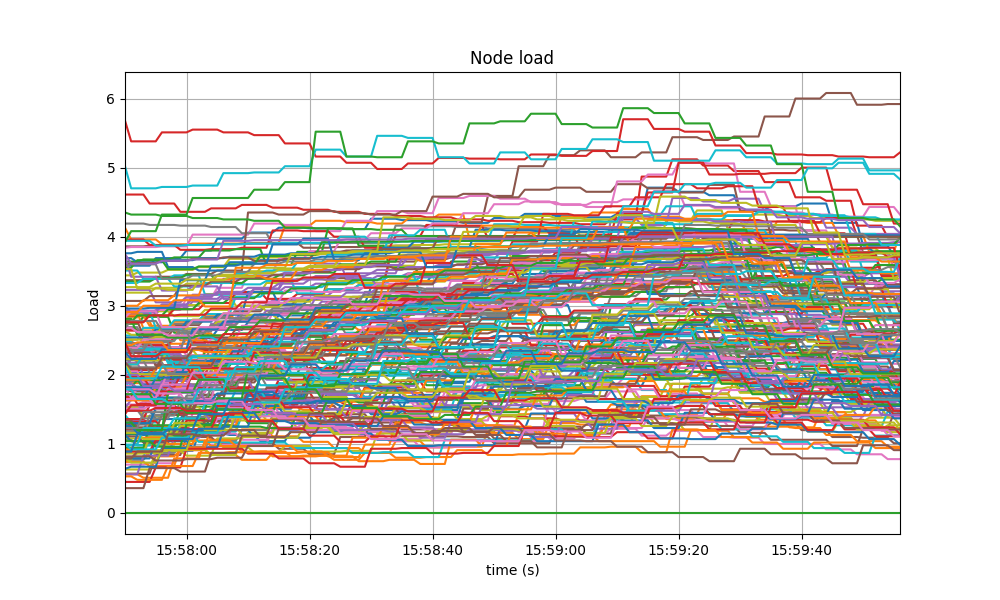
CPU utilization
The best metric from Prometheus to gauge CPU utilization in a Unix machine isload1,
as it usually appears in the
output of top.
It is contained below 5 on most nodes, as seen in the following graph.
Test Results
The comparison against the baseline results show that both scenarios had similar numbers and are therefore equivalent. A conclusion of these tests is shown in the following table, along with the commit versions used in the experiments.| Scenario | Date | Version | Result |
|---|---|---|---|
| CometBFT | 2023-02-14 | v0.37.0-alpha3 (bef9a830e7ea7da30fa48f2cc236b1f465cc5833) | Pass |